Product update
The Healthcare Data Map Has Been Updated: Explore and Compare Local Health Data
Explore listed hospitals, reported beds, population and projections, bed function reports, and facility-standard records on the map, tables, and charts, then compare hospitals using available public fields.
The Healthcare Data Map on Medical Machi Scope has been updated. Choose a municipality to explore listed hospitals, reported beds, population and projections, the Bed Function Report, and published facility-standard records using a map, tables, and charts. You can open a hospital’s public information and compare two or three hospitals on fields available for both. The public map is free to use and does not require an account.
Explore local healthcare data on a map
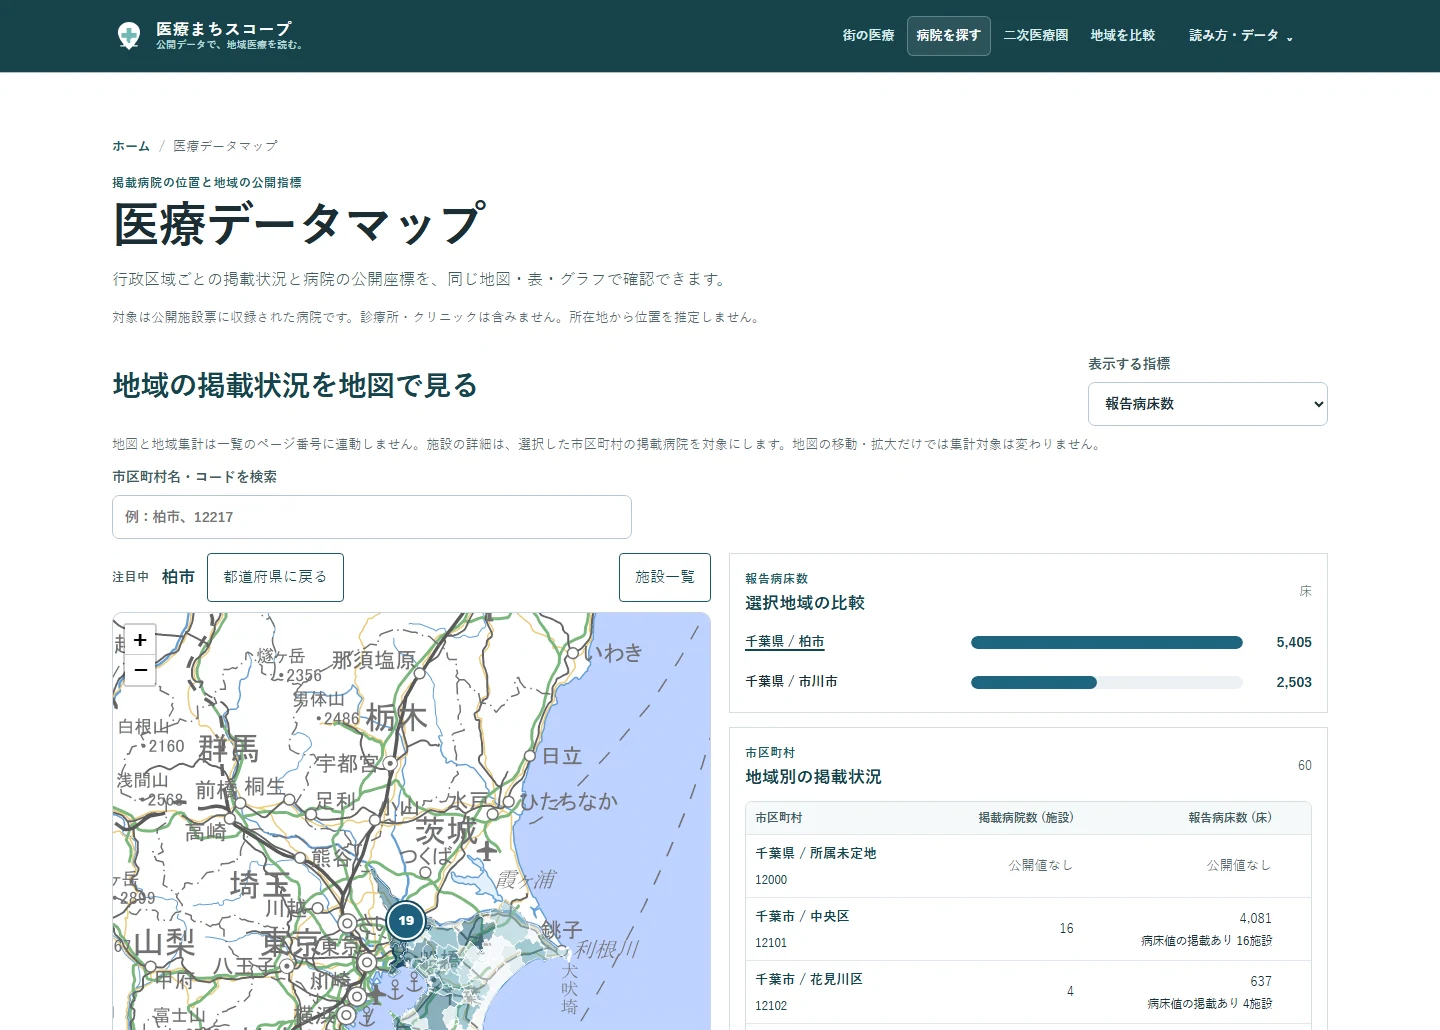
Select a municipality to see the same measure in the map, table, and bar chart. The basemap uses tiles from the Geospatial Information Authority of Japan (GSI). Hospital markers appear only where published coordinates are available. Selecting a hospital opens its published information. You can add municipalities to a comparison and return to your previous map state after viewing a regional or hospital detail page.
“Listed hospitals” means hospitals in the current published dataset; clinics are not included, so this is not a count of every medical provider in an area. Reported beds do not indicate vacancies or a hospital's current capacity to accept patients. The map’s geographic results are independent of the facility list’s page number.
Compare population and population projections
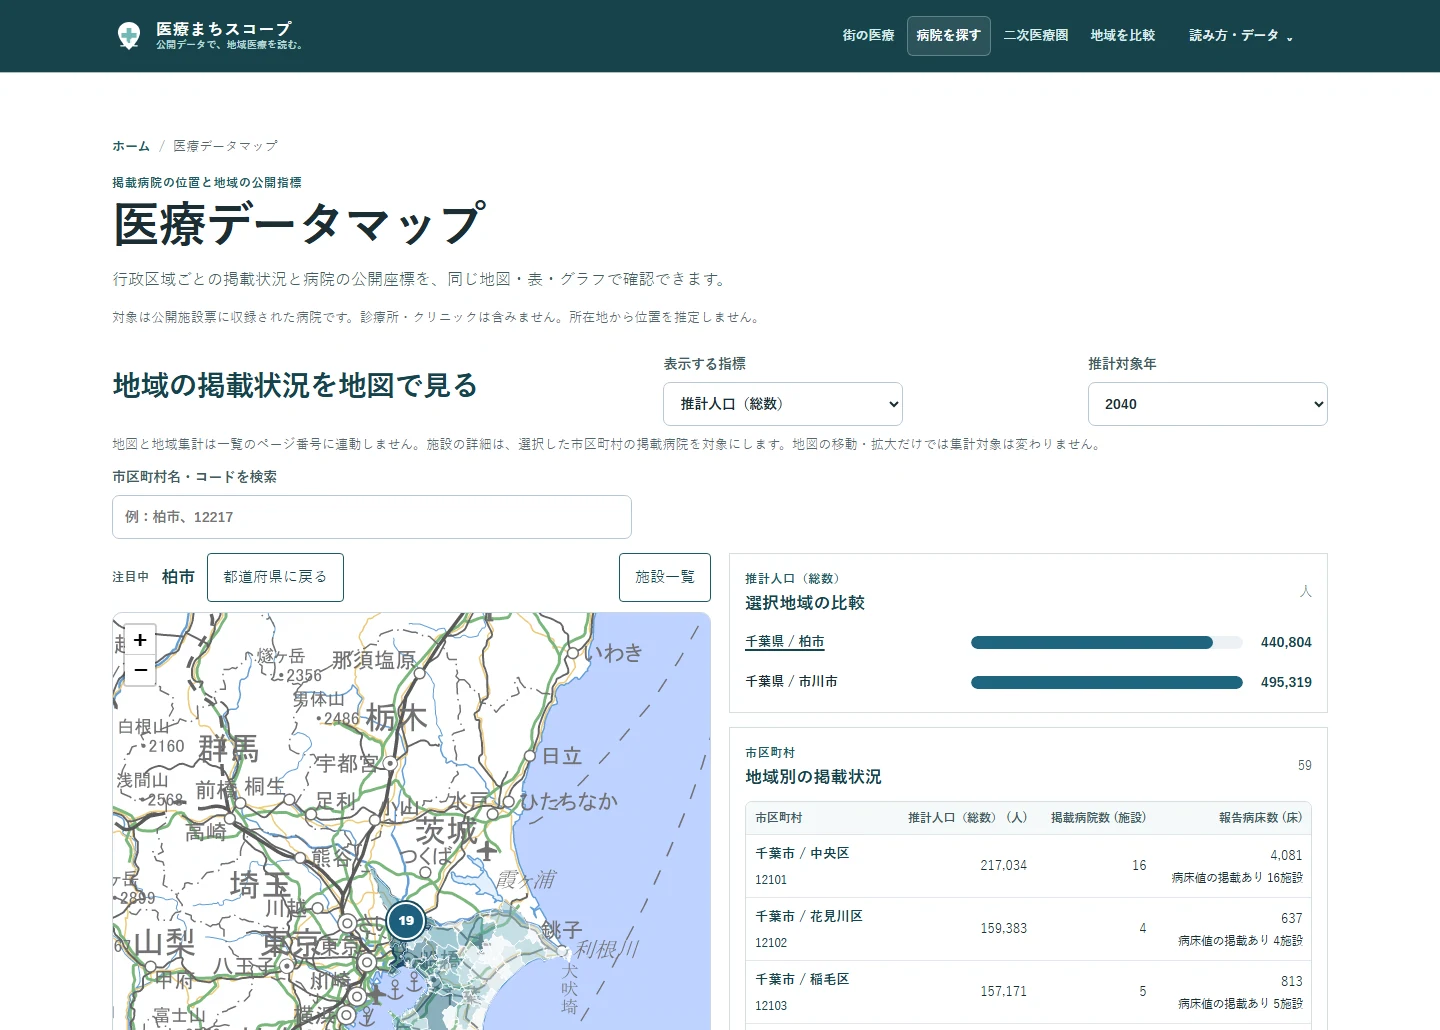
Switch measures to explore total population, children aged 0–14, or the number and share of people aged 65 or older where data are available. Reference years vary by measure. The age structure uses Japan’s 2020 Population Census, as of 1 October 2020. Projections use the National Institute of Population and Social Security Research’s 2023 estimates, with a 2020 baseline and projected years from 2025 to 2050. Check the year, unit, and source shown for the selected measure.
A projection is an estimate, not an observed future count. Municipality-level values are not silently added up into medical-area or prefectural totals. The map does not extend today’s hospital or bed counts into the future or infer a shortage from population and beds alone.
Explore the Bed Function Report and published facility-standard records
The Bed Function Report groups reported hospital wards into categories such as highly acute, acute, recovery, and chronic care. The R7 report shown here refers to 1 July 2025. Depending on available data, the municipality view shows reported ward counts, shares, and permitted beds for reporting wards with published values. A ward count is different from a bed count or a hospital count.
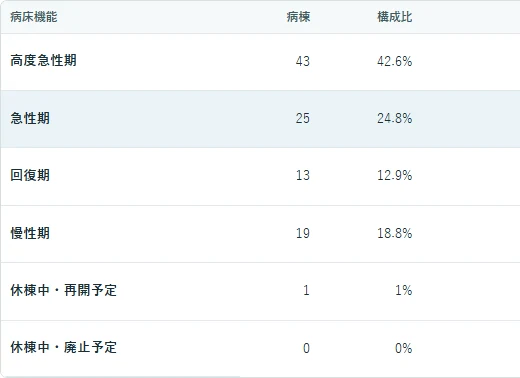
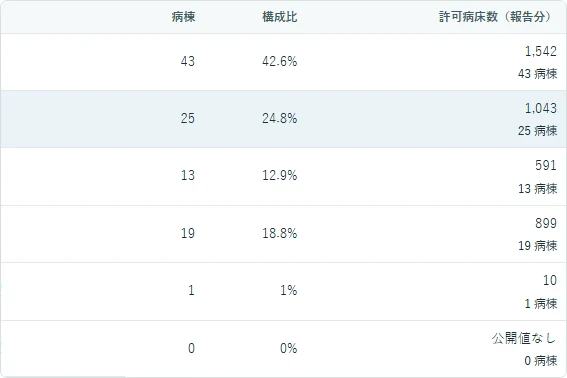
This report is aggregated at municipality level and has no verified link to the hospital IDs in the facility list, so it is not used as a hospital-comparison field. Its source, population, period, and unit also differ from facility-record reported beds. Neither measure indicates vacancies or a hospital's current capacity to accept patients.
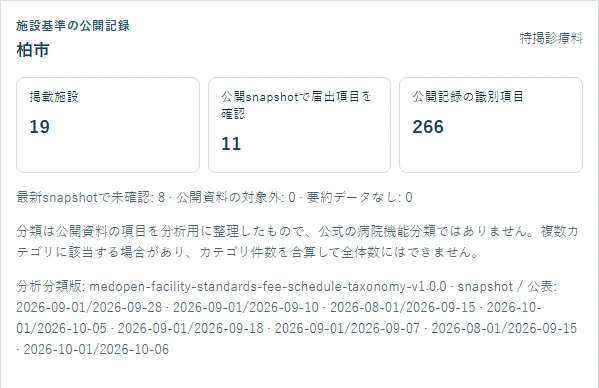
For facility-standard records, choose a category to find listed hospitals with matching items in the published snapshot. The categories are MedOpen’s analytical grouping of public items, not official hospital-function classes. A hospital may match multiple categories, so the counts are not mutually exclusive and should not be added as a total. Published item identities are also different from hospital counts. A facility not observed in a snapshot does not necessarily have no notification.
Compare hospitals using available public fields
Select two or three listed hospitals to compare fields such as location, facility-record reported beds, and items identified in the published facility-standard snapshot. Sources and reference dates appear by field; check that values answer the same question and cover the same period. The Bed Function Report is excluded because it cannot be reliably linked to individual hospital IDs.
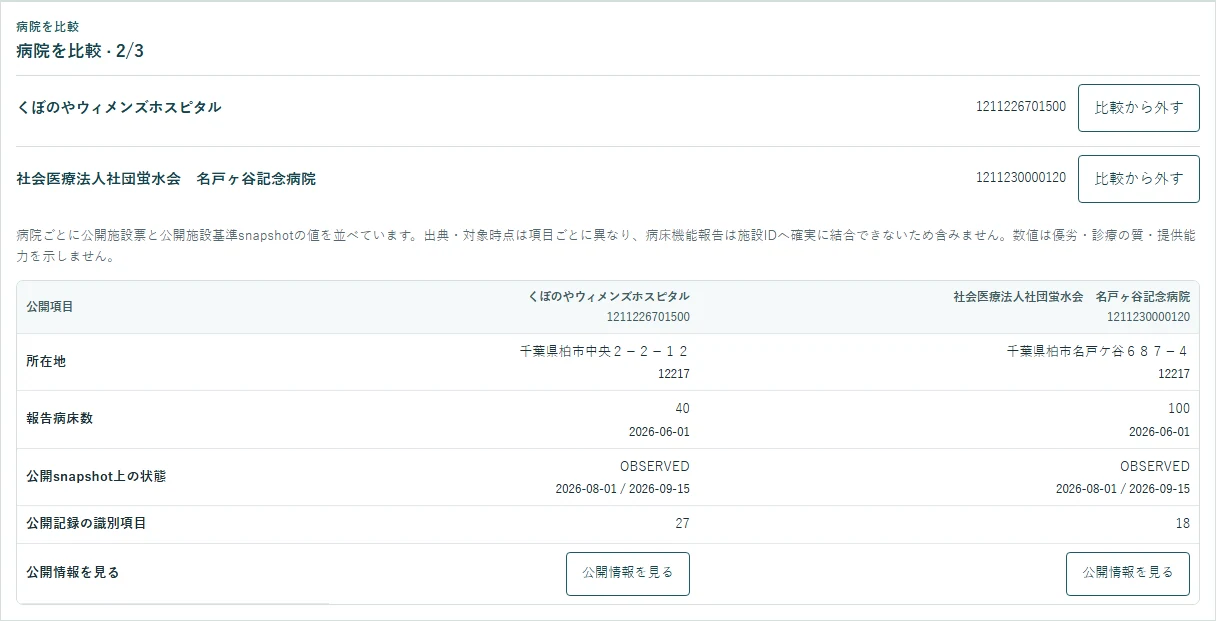
The comparison places public fields side by side. It does not rank hospitals or assess care quality, suitability for a patient, or which hospital is best. Use your browser’s Back button after opening a detail page to restore the comparison and map state.
How to use the Healthcare Data Map
1. Open the Healthcare Data Map. 2. Search for a municipality or select one on the map or in the table. 3. Choose a measure; choose a target year for population projections. 4. Review the same region in the map, table, and bar chart. 5. Open a listed hospital’s public information or select two or three hospitals to compare.
Tap or click an image to enlarge it. You can also find a municipality by name or official code and select it from the table.
Sources and notes
Hospital listings and facility fields use the Ministry of Health, Labour and Welfare’s Medical Information Net open data. The facility dataset reference date confirmed for these examples is 1 June 2026. Population observations, projections, the Bed Function Report, and facility-standard snapshots use different data, periods, geographies, and coverage. Check the source, date, and unit shown for each measure.
Zero, not published, not observed, not covered, and unavailable values are not interchangeable. Ward counts and permitted beds in the Bed Function Report, facility-record bed counts, and facility-standard records answer different questions. None of these counts alone measures care quality, access, or hospital superiority.
Open the Healthcare Data Map
To explore regional public information alongside its source and reference period, open the Healthcare Data Map. The public map is free to use and requires no account.
Sources
- Medical Machi Scope: Medical Data Map public page specifications (Reference period: Production display checked 2026-10-20)
- Geospatial Information Authority of Japan: GSI Tile List and Terms of Use (Reference period: Checked 2026-10-20)
- 厚生労働省: 医療情報ネットのオープンデータ (Reference period: 2026-06-01)
- 総務省統計局 / e-Stat: 令和2年国勢調査 (Reference period: 2020-10-01)
- 国立社会保障・人口問題研究所: 日本の地域別将来推計人口(令和5年推計) (Reference period: 2020 baseline / 2025-2050 projections)
- 厚生労働省: 令和7年度病床機能報告公表データ (Reference period: 2025年度報告・2026-09-22確認)
- 医療まちスコープ: 札幌医療圏・病床機能報告の構成 (Reference period: 病床機能2025-07-01・2026-09-22の表示を確認)
- 医療まちスコープ: 分析方法・施設基準の届出 (Reference period: 2026-09-22の公開仕様)
- 総務省統計局 / e-Stat: 市区町村コード・標準地域コード (Reference period: 参照日 2026-09-09)